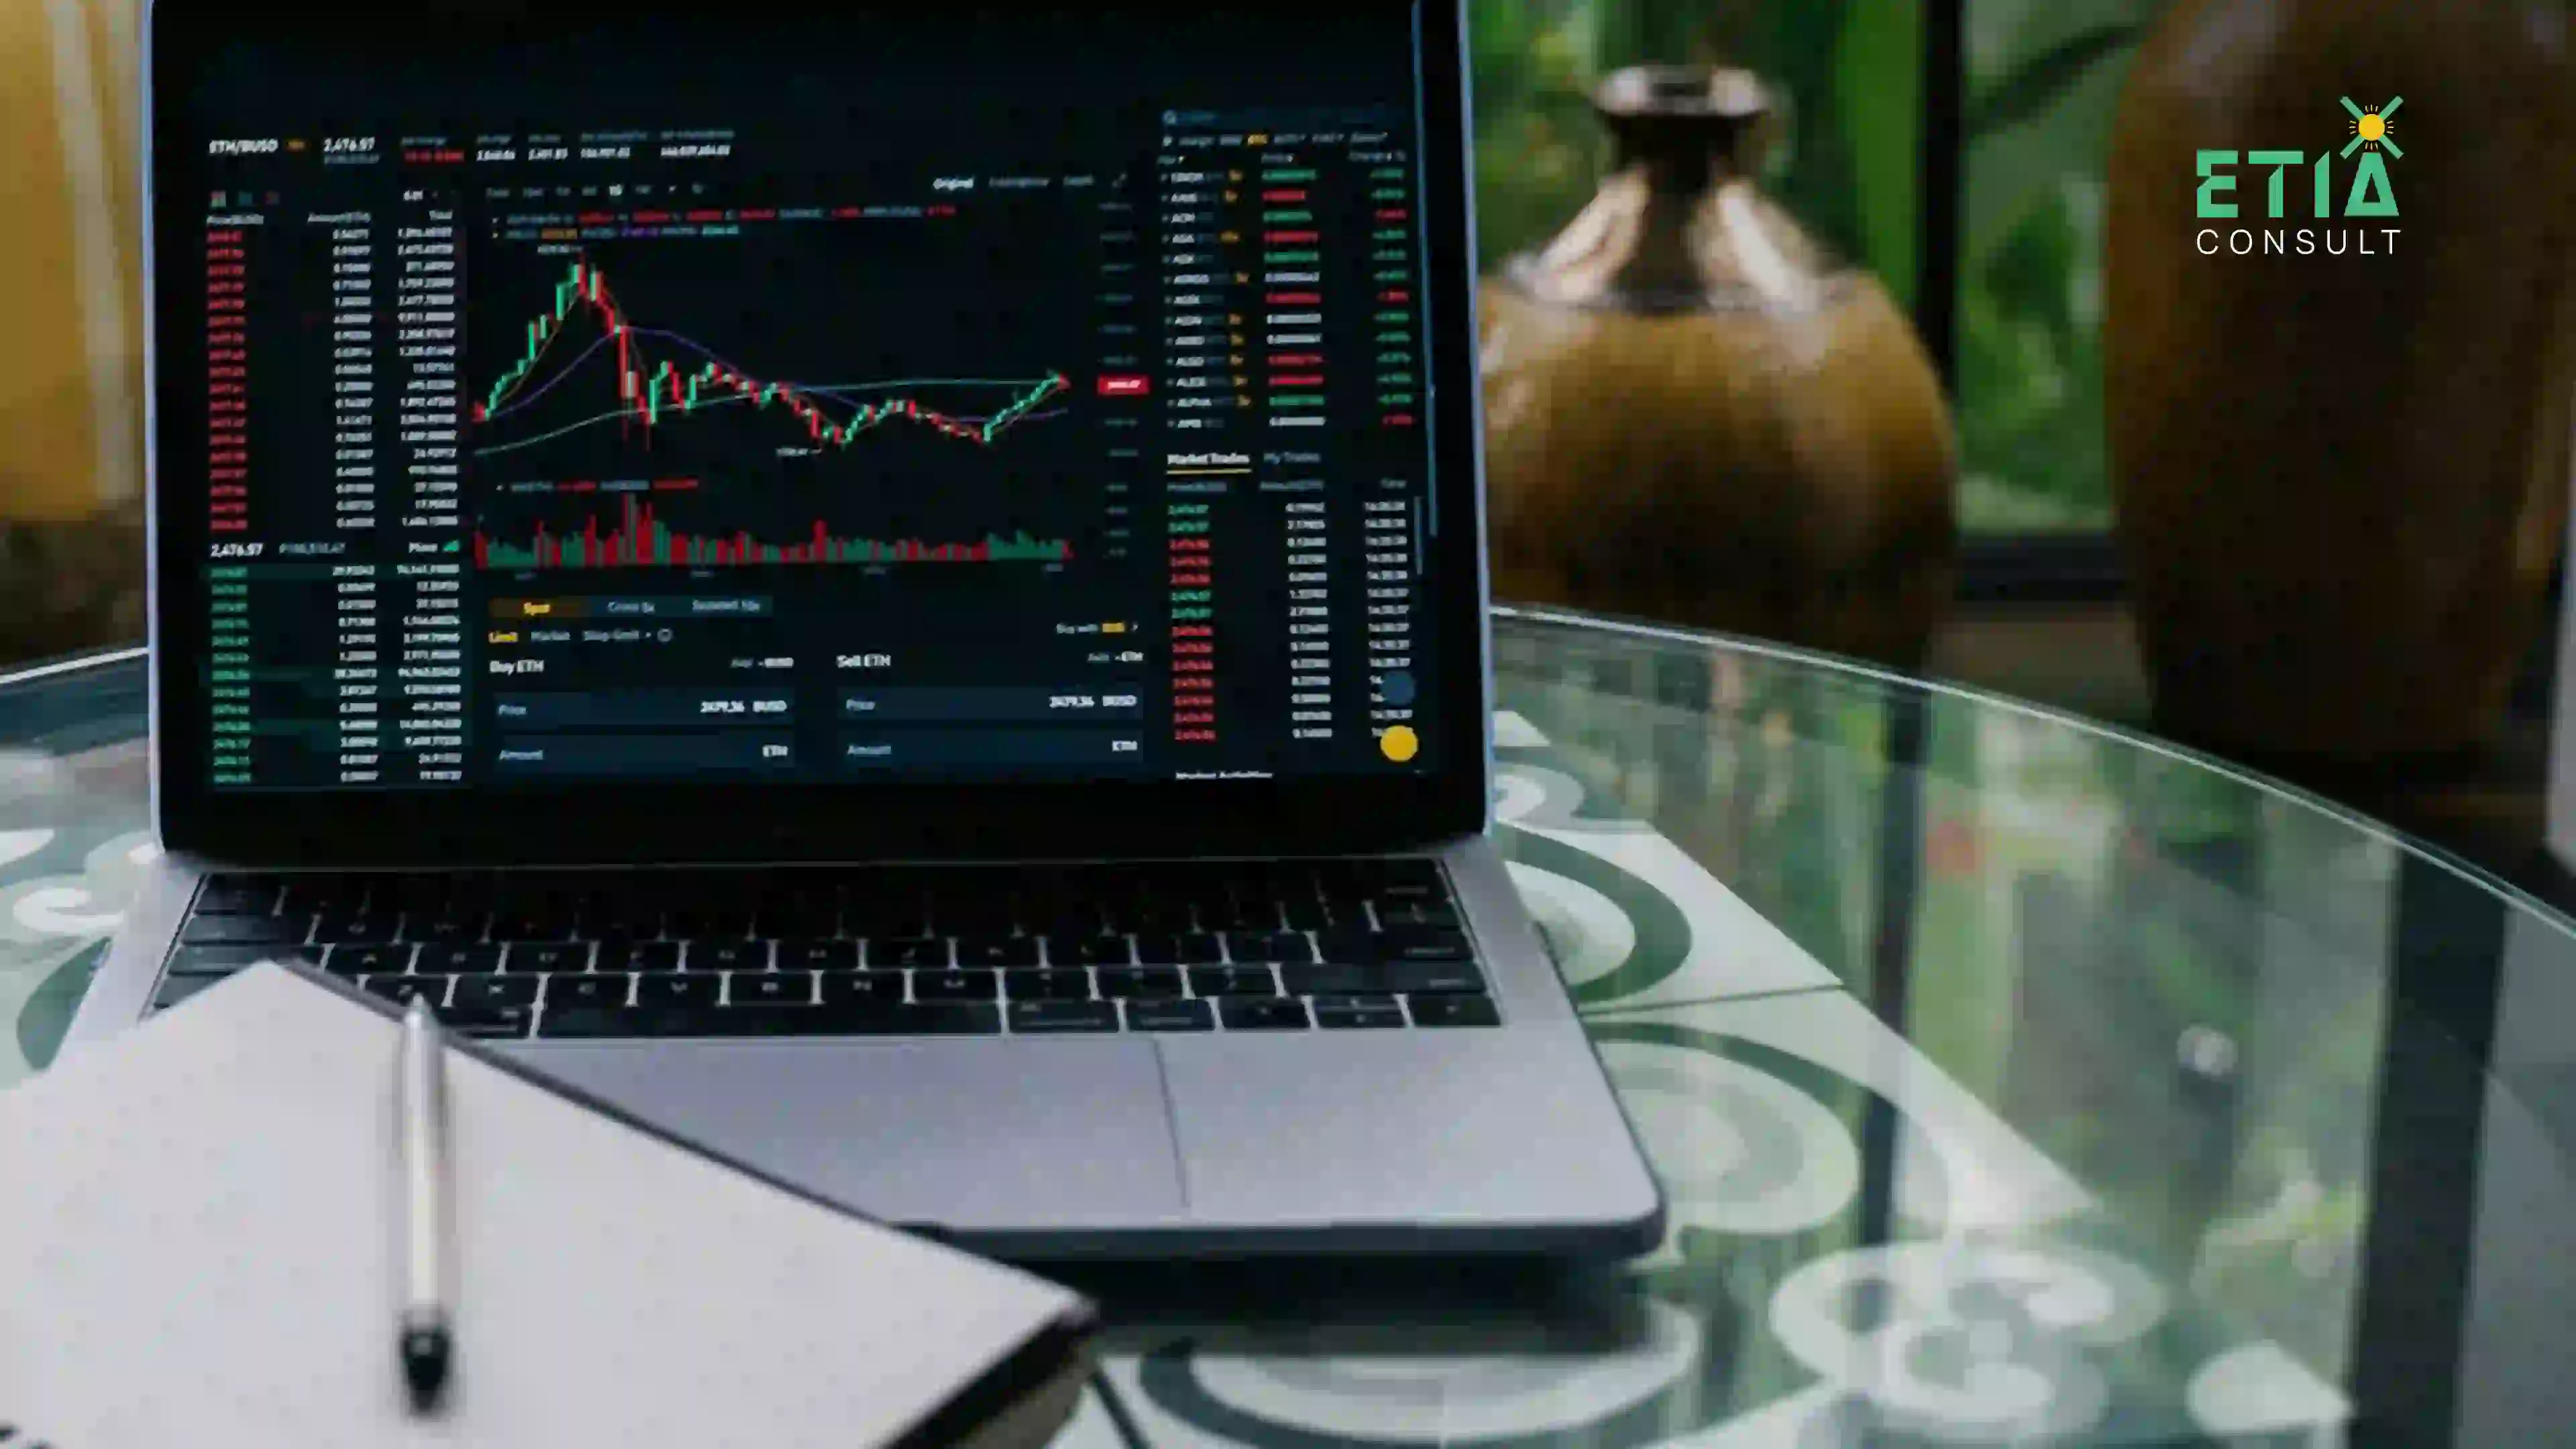



Energy market liquidity determines how smoothly electricity, natural gas and other energy commodities move between producers, suppliers, traders and consumers. The ability to buy or sell energy is not set by supply and demand alone — it also depends on how easily participants can complete transactions at competitive prices.
Liquidity influences trading decisions, price formation, risk management and the ability of energy companies to respond to changing conditions. In a liquid market, participants can generally execute transactions without causing significant price movements; in a less liquid one, even a small trade may move prices considerably or take longer to complete. Understanding it helps traders, utilities, generators, retailers and any organisation exposed to changing energy prices evaluate conditions, choose trading strategies and understand the risks of buying or selling energy.
What Is Energy Market Liquidity?
Energy market liquidity refers to how easily participants can buy or sell energy commodities without causing substantial changes in market prices. It reflects the availability of willing buyers and sellers, the volume of transactions and the ease with which trades can be completed. A trader purchasing electricity in a market with many active participants may find several competitive offers and complete the deal quickly at a price close to the prevailing level. In a less liquid market, fewer participants may be willing to trade: the buyer might accept a higher price, negotiate for longer or reduce the quantity, and a seller may face similar difficulties finding a suitable buyer.
Liquidity is not uniform across every product or trading period. A market may be highly liquid for a standard contract traded during regular hours but considerably less liquid for a specific delivery period, location or contract structure. This matters because electricity must be balanced continuously, storage options vary and transmission constraints can limit the movement of power between regions — all of which shape how liquidity develops.
Why Energy Market Liquidity Matters
Energy market liquidity supports the efficient functioning of energy markets. It helps participants transact, manage financial exposure and respond to changing conditions without relying entirely on individual negotiations.
It Supports More Efficient Price Discovery
Price discovery is the process through which buyers and sellers establish market prices from available information and trading activity. When many participants trade, prices can reflect a broader range of expectations about supply, demand, fuel costs, weather and generation availability. A market with limited participation may produce less representative prices, because a single large transaction can influence the observed price when few competing orders exist. Liquidity does not guarantee accurate prices, but it supports a more transparent and competitive price discovery process.
It Makes Trading Easier
Energy companies often adjust positions as forecasts change: a retailer may need extra electricity, while a generator may want to sell expected output in advance. In a liquid market there are more opportunities to find counterparties, which cuts the time and effort needed to complete transactions — especially useful when businesses must respond quickly.
It Helps Manage Price Risk
Energy prices can change rapidly with weather, fuel availability, plant outages, transmission constraints and shifts in demand. Companies use futures, forwards, swaps and other instruments to manage that exposure, and these are most useful when there is enough liquidity to establish, adjust or close positions at reasonable prices. If a contract is hard to trade, changing a position or exiting a deal becomes expensive — so limited liquidity can complicate risk management even when suitable hedging products exist, a theme we cover in our guide to energy risk metrics.
It Can Reduce Transaction Costs
Transaction costs include more than brokerage or exchange fees: they also cover the gap between buying and selling prices, the market impact of a trade and the time needed to find a counterparty. Liquid markets often offer more competitive pricing and greater choice, although costs still depend on the product, trading venue, contract size and prevailing conditions.

Key Indicators of Energy Market Liquidity
Market participants use several indicators to assess energy market liquidity. No single measure gives a complete picture, so they are generally read together.
Market Depth
Market depth describes the quantity of buy and sell orders available at different price levels. A market with substantial depth may absorb larger transactions without sharp price moves — if several sellers offer electricity near the current price, a buyer can purchase a larger quantity without moving it. A shallow market reacts more strongly to a large order. Depth can change quickly, though: orders may be withdrawn, and the displayed quantity may not match what participants will ultimately trade.
Trading Volume
Trading volume measures the quantity or number of contracts traded in a specified period. Consistently high volume can signal active participation and help participants judge whether a product attracts enough interest. But high volume alone does not guarantee strong liquidity: trading may be concentrated in a few transactions or limited to specific periods, so volume should be read alongside depth, spreads and ease of execution.
Bid Ask Spread
The bid ask spread is the difference between the highest price a buyer will pay and the lowest price a seller will accept. A narrower spread generally means buyers and sellers are willing to transact at similar prices; a wider one may suggest limited competition, greater uncertainty or higher trading costs. For example, if the best bid for an energy contract is €98 per megawatt-hour and the best offer is €100, the spread is €2 per megawatt-hour. If it widens significantly, entering and exiting a position costs more. The example is illustrative — actual spreads vary by market, product and conditions.
Market Turnover and Trading Frequency
How often transactions occur shows whether a market is consistently active or only sees isolated bursts. A product traded regularly through the day offers more chances to execute orders than one with long quiet periods, so turnover, transaction frequency and the spread of activity over time complement volume data.
What Influences Energy Market Liquidity?
Several factors determine how much energy market liquidity is available.
Supply and Demand Conditions
When supply and demand are predictable, participants find it easier to estimate prices and manage positions. Sudden changes — extreme temperatures or unexpected generation outages — raise uncertainty and alter trading activity, and demand spikes can make supply scarce, affecting both prices and participants’ willingness to trade.
Market Design and Regulation
Trading arrangements shape who can participate, which products exist and how deals complete. Transparent rules, reliable settlement, standardised contracts and accessible platforms encourage participation, while complicated procedures or restrictions create barriers. Regulatory changes can also affect trading obligations, market access and risk requirements — the structure explored in our article on energy market design and the obligations in our guide to energy trading compliance.
Infrastructure and Transmission Constraints
Power moves through networks of finite capacity, and congestion can limit transfers between locations. Electricity trading may therefore be liquid in one region and thin in another, and local shortages or constraints can create large price differences between locations — congestion is a live issue in the Netherlands, where TenneT runs studies on congestion management.
Market Participation
Liquidity benefits from diverse participants — generators, utilities, retailers, industrial consumers, financial traders and intermediaries. Some trade to secure physical supply, others hedge financial exposure or act on expectations. A broader range raises the chance that buyers and sellers find counterparties, though participation alone does not guarantee continuous liquidity.
Energy Market Liquidity in Electricity Trading
Electricity trading has particular liquidity challenges because electricity is difficult to store economically at large scale compared with many other commodities, although batteries, pumped-storage facilities and other technologies are increasingly important. Supply and demand must stay balanced across the power system, and prices vary by location and delivery period. Participants trade through several markets, each with a different purpose:
- Day-ahead markets: trade electricity for delivery on the following day
- Intraday markets: adjust positions as forecasts and operating conditions change
- Balancing markets: help system operators manage differences between scheduled and actual supply and demand
- Forward and futures markets: manage price exposure over longer periods
Energy market liquidity differs considerably across them: standardised contracts for widely traded periods may attract substantial activity, while uncommon delivery periods or specialised products have fewer participants — a pattern visible in the market data ACER reports in its electricity market monitoring reports. For electricity traders, that matters when choosing where and when to transact: a product that looks attractive on its quoted price may be unsuitable if there is not enough liquidity to enter or exit efficiently.
Commodity Liquidity and Its Role in Energy Trading
Energy markets cover natural gas, crude oil, refined petroleum products, coal and electricity, each with its own trading characteristics. Crude oil and certain natural gas contracts attract significant activity because they are widely used, supported by established infrastructure and followed by many participants — the Dutch TTF gas benchmark is a prominent example, with ICE reporting record TTF futures and options volumes in May 2023. Even so, liquidity varies between contract types, delivery locations and trading periods: a widely traded benchmark may be highly liquid while a regional product with specialised delivery requirements is harder to trade.
Commodity liquidity also shapes the link between physical and financial markets. A company buying fuel may hedge with a financial contract, but the hedge works only as well as the contract tracks its actual costs. Understanding the liquidity of both the physical commodity and the financial instrument helps businesses spot mismatches and trading risks — and feeds into any sound energy procurement strategy.

How Businesses Can Manage Liquidity Risk
Energy companies cannot always control energy market liquidity, but they can take practical steps to manage the risks that come with it:
- Monitor liquidity indicators: review trading volume, market depth, bid ask spreads and transaction frequency
- Plan transactions carefully: large orders may need splitting into smaller transactions to reduce market impact
- Diversify trading opportunities: where appropriate, consider alternative contract periods, products or venues
- Review hedging strategies: make sure hedging instruments have sufficient liquidity and match the company’s exposure
- Establish risk limits: set clear limits for position sizes, acceptable spreads and exposure to hard-to-trade products
- Maintain reliable market information: use credible data sources and review conditions regularly
Businesses should also recognise that liquidity can deteriorate in market stress — Europe’s regulators saw this when volatility drove large margin increases, as ESMA describes in its report on emergency collateral measures. A strategy that works in normal conditions may weaken when participants withdraw or prices move sharply. Regular monitoring and scenario analysis help organisations prepare, and good market data — see our piece on energy intelligence — makes both easier.
Conclusion
Energy market liquidity is a fundamental feature of effective energy trading. It influences how easily participants can buy and sell commodities, how prices are established and how businesses manage financial and operational exposure. Market depth, trading volume and the bid ask spread give useful insight into conditions, but they should be read together rather than in isolation, and energy market liquidity varies across commodities, locations, contract types and delivery periods.
For organisations in electricity trading and wider commodity markets, understanding these differences supports better decisions. By monitoring liquidity, planning transactions carefully and reviewing hedging strategies, businesses can manage trading costs and prepare for changing conditions — and ETIAConsult can help build that discipline through strategic consulting and technology integration. Ultimately, liquidity is not simply a measure of trading activity; it determines how effectively energy markets connect commercial needs with available supply.
Frequently Asked Questions
Key questions on liquidity in energy markets
Build a Liquidity-Aware
Trading Approach
ETIAConsult helps organizations in the Netherlands and across the EU monitor liquidity, set risk limits and plan transactions with confidence.